Marketing analytics designed to drive revenue and course engagement.
6
Platforms integrated
5
Dashboards delivered
When Miss Excel launched her new online course site, she wanted to make sure the data she gets from her site is as clean and actionable as the data in her spreadsheets.
We partnered with her to deliver end-to-end marketing analytics work for her new site: strategy, implementation, and visualization.
This helped unlock new insight about her channels, UX, and product mix.
“Working with Michael and the Flywheel team has been an absolute dream! They quickly and efficiently built me an easy to use dashboard with all the metrics I have been dying to know! Their team went above an beyond to make sure I had everything I needed to track my business metrics and understand the data.
If you are on the fence about working with Flywheel I say, DO IT! You will be so happy you did!
KAT NORTON
Miss Excel
Context
Kat Norton teaches people to use Excel and other business tools under the name Miss Excel. She’s gained over a million followers across TikTok and Instagram by making it fun and accessible to everyone.
When she launched her new online course site, she wanted to make sure the data she gets from her site is as clean and actionable as the data in her spreadsheets.
We partnered with her to deliver end-to-end marketing analytics for her new site: strategy, implementation, and visualization.
Results
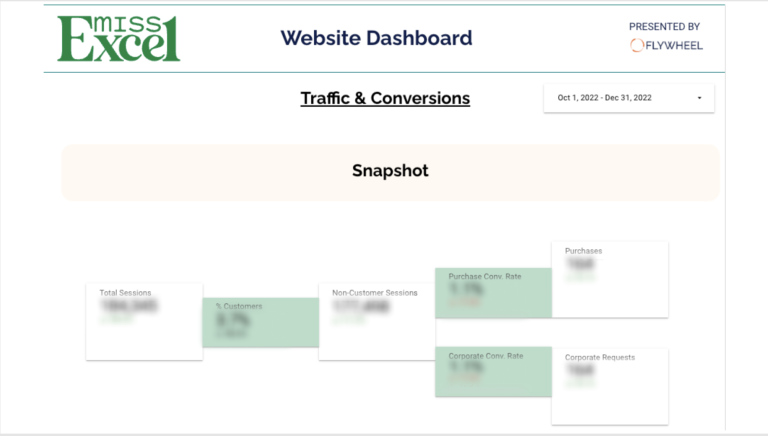
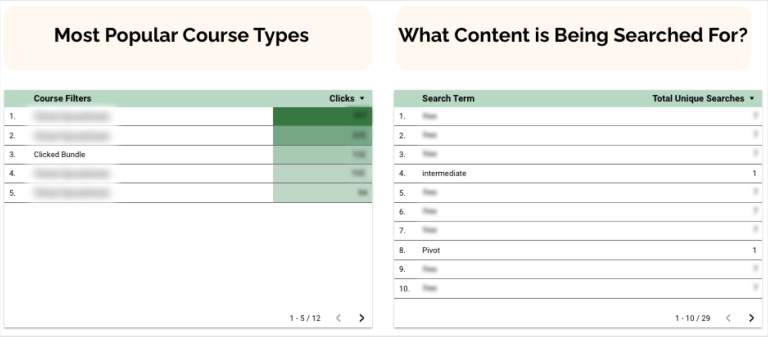
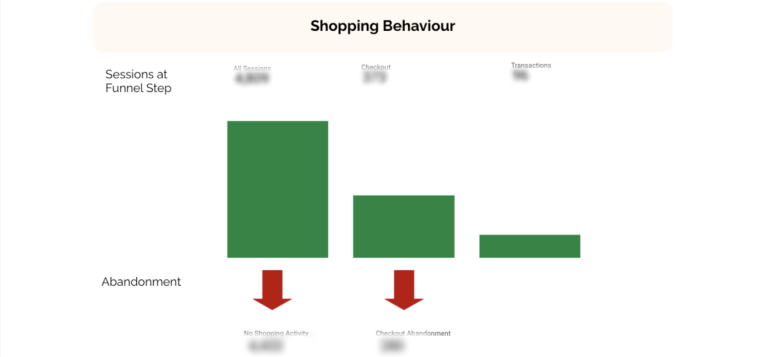
Post-launch, Kat was able to continue scaling her course business with access to actionable, reliable, easy-to-use data. Using the dashboard in the screenshots below, she was able to identify what courses converted best, how her campaigns were performing, and what new courses people might be interested in.
Dashboard page: Top-level performance overview
Dashboard page: Measuring clicks for different FAQ questions, surfacing what’s most important or unclear to people.
Dashboard page: Insights on most-visited courses and most-searched terms on on-site search
Dashboard page: Drop-off rates at each step of checkout
Process
Our Measurement Strategy translates a business’ goals into measurable metrics. For Kat, this isn’t just sales. Her site drives online course engagement and the growth of her email and social presence.
We also needed to provide insight into how to improve those metrics through segmented reports such as funnel drop-offs, on-site search terms, and course completion rates.
We achieved this by unifying data across her tech stack: Thinkific, Beehiiv, WebinarJam, Clarity, and Google Tag Manager/Analytics. We coordinated with our partner, Course Studio, to ensure this was tracked from launch day.
As a creator, business owner, and analyst, Kat wears many hats. So our dashboard needed to be immediately insightful at a glance. With her data expertise, it also needed to be robust enough for her to analyze the results. So we broke it into two sections: “Performance” for snapshots and “Insights” for deep drill-downs.
Ready to unlock your data’s full potential? Shoot us a message to see how we can drive results like this for your business.
Let’s talk!
Interested in working together? Fill out the form and we’ll reach out to schedule a discovery call.